Introduction to Trading View and Its Key Features
In the rapidly evolving world of financial markets, having access to real-time data, sophisticated analysis tools, and a vibrant trading community is crucial for success. trading view has emerged as a leading platform that consolidates these needs into a single, user-friendly interface. Whether you’re a seasoned trader or a beginner, understanding what makes Trading View stand out is vital for harnessing its full potential. This comprehensive guide explores the platform’s core features, benefits, and how it can transform your approach to trading and investing.
What Is Trading View and Why It Matters
Trading View is more than just a charting tool; it is an integrated social network for traders and investors worldwide. With millions of users, it offers a unique blend of market analysis, social sharing, and community-driven insights. Its importance lies in democratizing access to complex analytical tools, making advanced technical analysis accessible to all levels of traders. By providing real-time data on stocks, forex, cryptocurrencies, commodities, and indices, Trading View helps traders make informed decisions swiftly. Its cloud-based platform ensures seamless access across devices, fostering continuous engagement in the global markets.
Core Features and Tools for Traders and Investors
Trading View’s arsenal of features is designed to facilitate comprehensive market analysis and efficient trading workflows:
- Advanced Charting Tools: Multiple chart types (candlestick, line, bar, etc.), customizable timeframes, and a vast selection of technical indicators.
- Drawing and Annotation Tools: Trend lines, Fibonacci retracements, geometric shapes, and text annotations for detailed technical analysis.
- Real-Time Alerts: Custom alerts for price levels, indicator signals, or drawing tools to stay ahead of market movements.
- Market Screeners: Extensive filters for stocks, cryptocurrencies, forex, and more to identify trading opportunities quickly.
- Social and Community Features: Sharing ideas, commenting, and collaborating with a global trading community to refine strategies and learn from others.
- Automated Trading Capabilities: Scripting with Pine Script for backtesting strategies and automating trades.
How Trading View Compares to Other Platforms
While there are numerous charting and trading platforms available, Trading View distinguishes itself through its combination of features, accessibility, and community engagement. Unlike proprietary desktop software, Trading View offers cloud-based accessibility, enabling traders to operate from any device without installing software. Its extensive library of indicators and scripts surpasses many competitors, providing versatile analytical tools. Furthermore, the platform’s social network fosters peer-to-peer sharing, providing real-time insights that are often missing in traditional platforms like MetaTrader or ThinkorSwim. This social dimension transforms individual analysis into collective wisdom, adding an invaluable layer of context for decision-making.
Getting Started with Trading View
Creating and Customizing Your Trading View Account
Getting started with Trading View is straightforward. Users can register for a free account, which provides access to the platform’s core features. For traders requiring more advanced tools, premium subscriptions offer additional benefits such as extended data ranges, multiple alerts, and enhanced customer support.
Customization options include setting up personalized watchlists, choosing preferred chart types, and organizing workspace layouts to suit individual trading styles. Once logged in, you can save your layouts, indicators, and alerts, ensuring a tailored experience every time you log in.
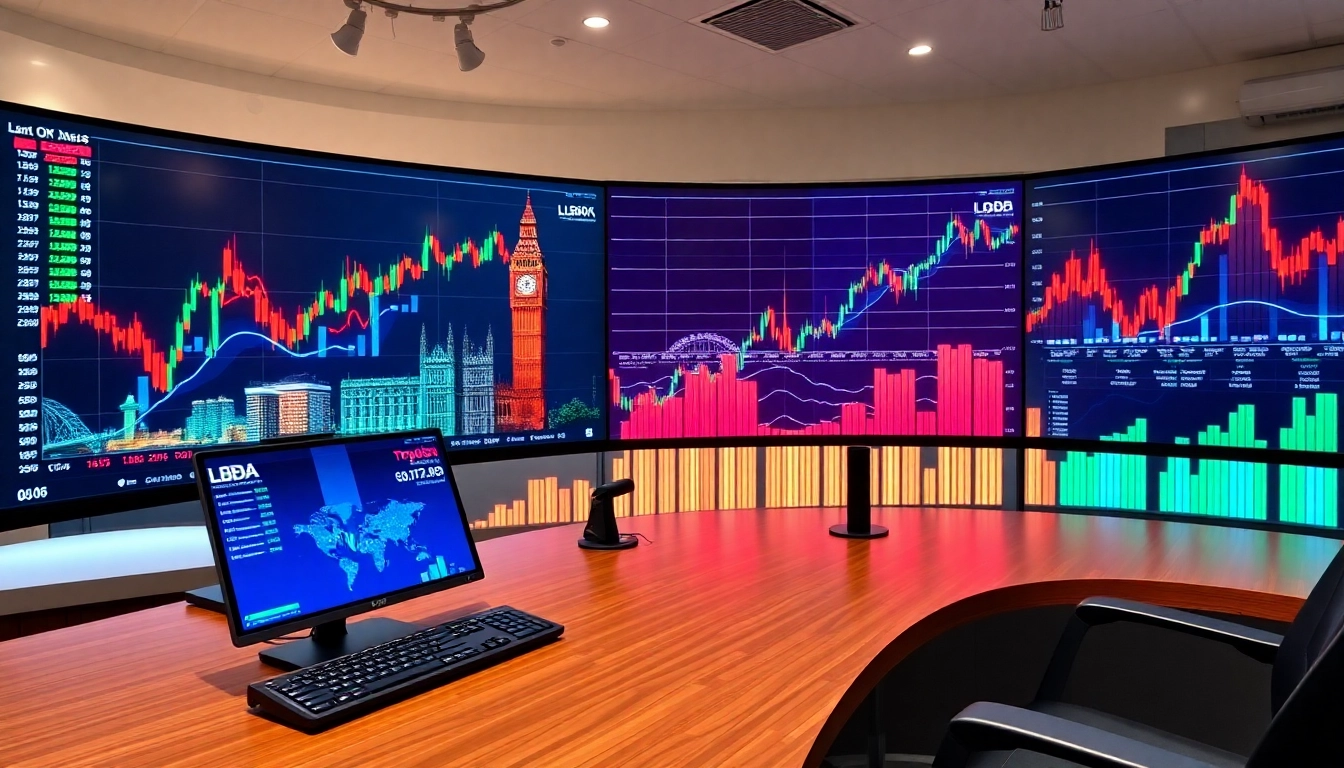
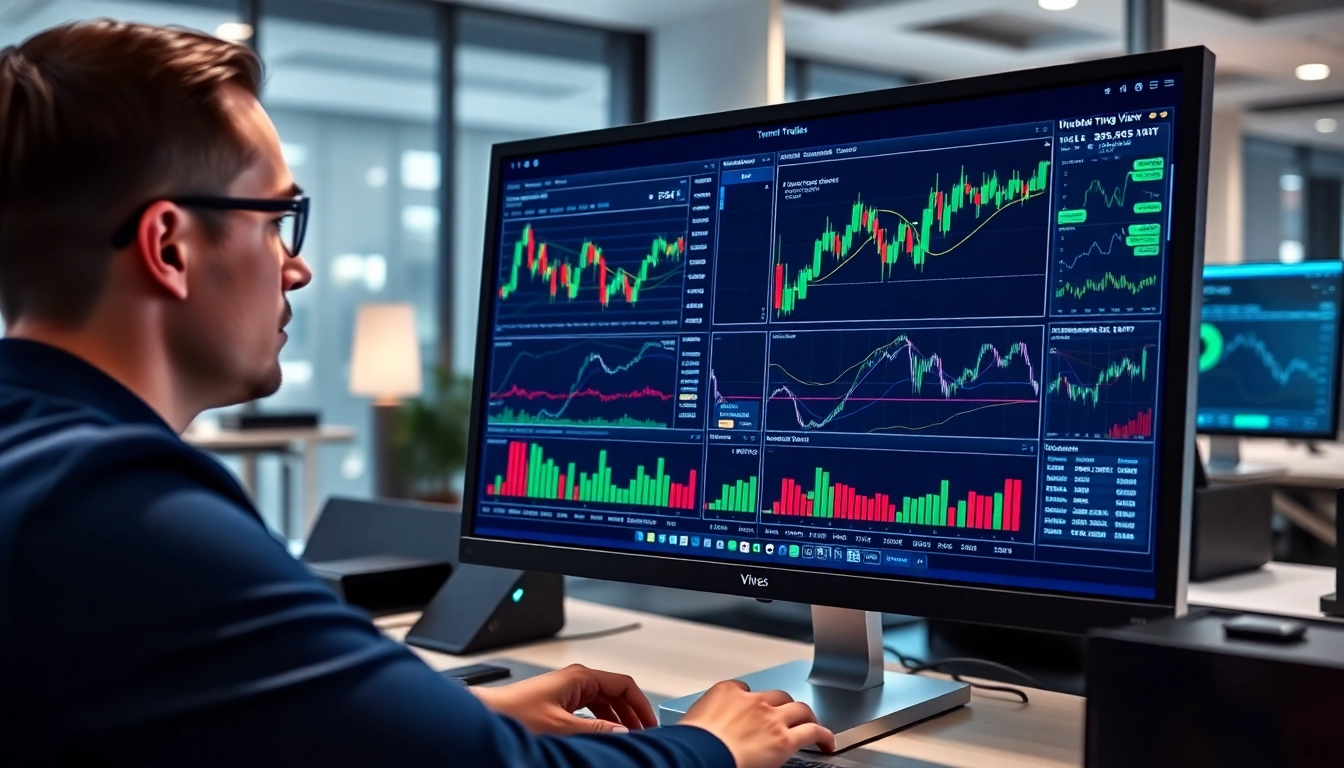
Understanding Market Charts and Technical Indicators
Market charts are the backbone of technical analysis. Trading View provides interactive, highly customizable charts that display historical price data vividly. Users can overlay hundreds of technical indicators, such as Moving Averages, RSI, MACD, Bollinger Bands, and more, to identify trends and signals.
Learning to interpret these indicators is crucial. For example, Moving Averages help identify trend direction, while RSI indicates potential overbought or oversold conditions. Combining multiple indicators enhances accuracy and reduces false signals, empowering traders to make data-driven decisions.
Setting Alerts and Watchlists for Better Market Monitoring
Effective market monitoring relies on customized alerts and watchlists. Trading View allows you to set alerts based on price levels, indicators, or specific chart patterns. When triggered, alerts notify you via email, SMS, or pop-up notifications, ensuring you never miss critical movements.
Watchlists enable quick access to selected assets, monitored in real-time. By organizing assets into categories, traders can efficiently track multiple markets simultaneously. Setting up alerts on these watchlists ensures timely action in volatile conditions.
Advanced Trading View Strategies
Utilizing Drawing Tools and Technical Analysis
Drawing tools elevate technical analysis beyond mere observation. Traders use trend lines to identify support and resistance, Fibonacci retracements to predict reversal zones, and geometric shapes to visualize patterns like head and shoulders or triangles. Combining these tools aids in confirming signals from indicators and reducing false positives.
Comprehensive chart analysis can be complemented by pattern recognition features within Trading View, facilitating predictive analysis based on historical price behavior. Mastering these tools enhances your ability to develop robust trading strategies.
Implementing Automated Trading and Scripts
Pine Script, Trading View’s scripting language, allows traders to develop custom indicators, alerts, and automated trading strategies. Backtesting these scripts against historical data helps evaluate their effectiveness before live deployment.
Automation reduces emotional decision-making and ensures disciplined trading. Beginners can start with pre-built scripts from the Trading View community, while advanced users can develop proprietary algorithms tailored to their specific strategies.
Sharing and Analyzing Community Ideas
The Trading View community is a vibrant hub for sharing ideas, strategies, and market insights. Users publish charts annotated with their analyses, facilitating peer review and collaborative learning. Analyzing community ideas can provide diverse perspectives, identify emerging trends, and inspire new approaches.
Engaging actively with the community also enhances your visibility and credibility as a trader, fostering networking opportunities and mentorship prospects.
Optimizing Trading View for Different Markets
Stock and Index Trading Strategies
Trading View excels in stock and index analysis with comprehensive data from major exchanges. Traders utilize sector rotation, trend following, and breakout strategies, all of which can be fine-tuned using custom indicators and alerts. Monitoring indices like the S&P 500 via Trading View’s integrated tools helps gauge overall market sentiment and adjust positions accordingly.
Cryptocurrencies and Digital Assets
The platform’s real-time data integration from multiple crypto exchanges makes it ideal for digital assets. Crypto traders employ technical patterns such as head and shoulders and flags to predict reversals or continuations. Trading View’s extensive library of crypto-specific indicators, alongside social insights, supports strategic trading in this highly volatile sector.
Forex, Commodities, and Futures Trading
Forex traders benefit from high-precision charts and customizable overlays for currency pairs. Commodities and futures traders leverage the platform’s ability to analyze seasonal patterns, supply-demand curves, and macroeconomic news effects. Alerts on key price levels help in swift execution amid fast-moving markets.
Measuring Success and Improving Your Trading Skills
Tracking Performance with Trading View Analytics
Trade performance analysis is essential for refinement. Trading View offers portfolio tracking and trade journal features that help evaluate strategy outcomes. Key metrics such as win rate, average profit/loss, and risk-reward ratios inform ongoing improvements.
Integrating Trading View with Other Platforms
While Trading View is robust, integrating it with brokerage accounts and other analytical tools expands its utility. Many brokers support direct integration or allow exporting data for further analysis. Using APIs, traders automate data sharing to streamline workflows and enhance decision-making precision.
Staying Updated with Market Trends and Community Insights
Regularly reviewing community ideas, market news feeds, and social media updates within Trading View keeps traders informed about the latest trends. Participating in discussions and following influential analysts enriches market understanding, providing a competitive edge.